Posted August 19, 2023
FutureHurricanes.Com is just for fun, my real job is snow. For the record, we predicted the date, location and path of the storm, right here, on May 19th. Here is the link https://futuresnow.co/hurricane-forecast-2023/

Hurricane Hilary will weaken as it reaches the cooler water near SanDiego. The cool water actually comes from the Alaskan Current that runs down the coast from the gulf of Alaska. That is why hurricanes are so rare on the west coast.

Projected Storm Totals
The exact opposite occurs on the East Coast, the warm water from the Gulf of Mexico and Caribbean flows north to the coast to Maine—the Gulf Stream Current.
Hurricane Hillary is just another amazing example of the cycling pattern, the LRC (Lezaks recurring cycle). Look at these next two charts. Even though the new pattern is developing as we speak, the old pattern still cycling through. First, the most recent (today), and then last cycle.


Do you see how similar these charts are? That little “asterisk” at the same meridian as the present chart where Hillary is located. You can’t make this s- – – – up!
The snow will be flying soon!
Posted May 19, 6:26 am MT 5:26 PT
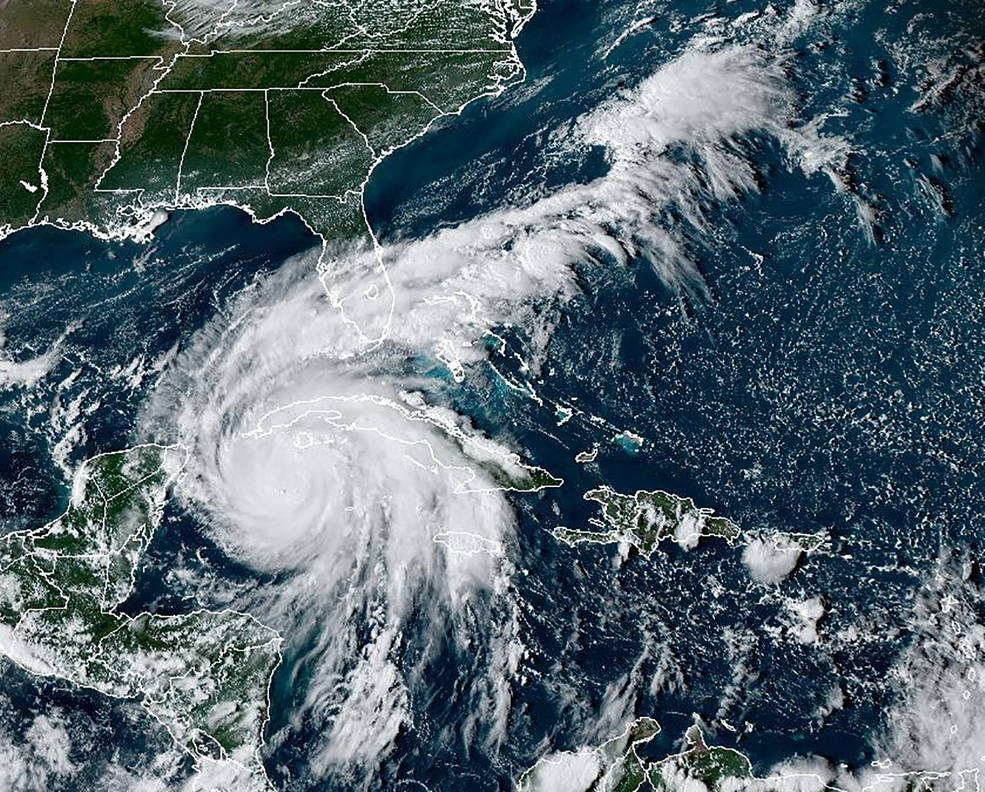
Hurricane Ian
Hurricane Forecast
The LRC (Lezak’s Recurring Cycle) can be used to calculate storms during hurricane season, based on indications of what has occurred during the cycling pattern, since it evolved back in October. This fall’s hurricane season will have 3-4 landfall events, with a total of 7-9 hurricanes.
A reflection of last year’s Hurricane Ian and Nicole will likely hit Florida again, with also a Gulf of Mexico and a Pacific storm, hitting somewhere between central to northern Mexico, including the possibility as far north as San Diego, which rarely gets hurricanes. Below are the listed dates along with alternate dates, 1 cycle earlier in parenthesis.
Below are the forecasted dates, in parenthesis, the early possibility’s, 1 cycle earlier.
Florida August 30-September 6th (July 12-19th)
This storm will come through Cuba, Puerto Rico or both hitting the eastern coast of Florida. It will then move north Northeast through the Carolinas and farther up the east coast exiting around Maine.
Sept 6-7th Louisiana (low possibility)
This storm is kind of either/or situation. If the above storm doesn’t hit Florida, it could take an alternate path, south of Florida, to Louisiana. Florida (above storm) is the most likely location. There is a possibility of this storm originating in the Gulf and moving East hitting the West Coast of Florida, but that is unlikely.
Yucatan Peninsula South to Honduras Sept 30 to October 3rd
Watch out Cancun travelers. This storm will originate in the Caribbean Sea and move west.
Pacific Storm Sept 30 to October 5th (August 12-17th)
This storm will originate of the South American west coast and move north northwest, likely west of Baja California, turning northeast around San Diego.
Thanks for reading, as always, if you have any questions, please email me at Mike@FutureSnow.CO
Cycle Comparison 22-23 (3 Cycles)
The video moves at a slow pace, but even with the slow pace, it is hard to see everything on the screen, so use the slider to move at your own pace.
I am really proud of this video because first, it shows the fluctuation of the amplified pattern in each of the 3 cycles. Amplification occurs from a combination of teleconnection influences, such as, the Artic Oscillation, El Nino Southern Oscillation, Madden Julian Oscillation, and others. When these influences align the pattern is amplified.
Second, the storms are closely synchronized. Each frame advance is a quarter day. You can see how the storms in each cycle closely follow the same track with slightly different timing.
Finally, the amplification. You can see how much the size and scope of the storms change. Especially the California storms. The amplification drops the angle of the storms to a more linear flow into the Sierra.
Posted August 16, 2023

Hurricanes Rare in San Diego
Since 1850, a mere eight tropical cyclones have unleashed their gale-force winds upon San Diego. These include the San Diego Hurricane, in 1858, Emily in 1965; remnants of Hurricane Joanne in 1972; and what was left of Hurricane Kathleen in 1976.
Hurricane Nora (1997) was downgraded to a tropical storm, and Hurricane Kay (2022), which struck Baja California as a Cat 1 Hurricane. The aftermath Kay’s remnants traversed Southern California, unleashing floods and wind gusts of up to 100 mph (160 km/h) in certain regions.
In the majority of cases, the primary impact of these cyclones on California manifests as rainfall. Occasionally, this precipitation escalates to a point of severity, leading to floods and resultant damage.

This storm is forming right now, in the warm waters off the coast of South America. Pacific storms are more likely this year, due to the warm waters from El Niño. We have already seen Hawaii being directly impacted by Hurricane Dora, which we talked about the possibility of a storm, hitting Hawaii in our official Hurricane Forecast May 19th. The echo of Dora could return between September 27 and October 5th
Atlantic and Gulf of Mexico storms are less likely this year, due again to El Niño. El Niño affects the trade winds, somewhat blocking them in the aforementioned areas. Hurricanes are still possible though, and we have predicted a strong possibility for Florida, and the gulf coast near Louisiana, to be hit.
Posted June 3, 5:26 am MT 4:26 PT
Hurricane Forecast
Hurricane Ian
The LRC (Lezak’s Recurring Cycle) can be used to calculate storms during hurricane season, based on indications of what has occurred during the cycling pattern since it evolved back in October. This falls hurricane season will have 3-4 landfall events, with a total of 7-9 hurricanes.
Florida will likely be hit again, with also a Gulf of Mexico and a Pacific storm, hitting somewhere between central to northern Mexico, including the possibility of San Diego, which rarely gets hurricanes.
Florida August 30-September 6th
This storm will come through Cuba, Puerto Rico or both hitting the eastern coast of Florida. It will then move north Northeast through the Carolinas and farther up the east coast exiting around Maine.
Sept 6-7th Louisiana (low possibility)
This storm is kind of either/or situation. If the above storm doesn’t hit Florida, it could take an alternate path, south of Florida, to Louisiana. Florida (above storm) is the most likely location. There is a possibility of this storm originating in the Gulf and moving East hitting the West Coast of Florida, but that is unlikely.
Yucatan Peninsula South to Honduras Sept 30 to October 3rd
Watch out Cancun travelers. This storm will originate in the Caribbean Sea and move west.
Pacific Storm Sept 30 to October 5th (Possibly 1 cycle earlier, August 12-17th)
This storm will originate of the South American west coast and move north northwest, likely west of Baja California, turning northeast around San Diego.
Thanks for reading, as always, if you have any questions, please email me at Mike@FutureSnow.CO

View of 10-Mile Range Breckenridge
Summary
I hope you are enjoying the summer! In this blog, I clean up some loose ends in regard to predicted atmospheric river events for Seattle, list the summer Hurricane predictions, update the California heat wave prediction, and update the present ENSO (El Niño Southern Oscillation) condition.
Many of you know we accurately predicted Hurricane Ida, last year. We predicted when and where the hurricane would hit. You can find that blog post below.
The current hurricane prediction, as well as the predicted fourth atmospheric river, was posted April 3. You can read that blog post below.
Fourth Straight Atmospheric River (AR)
I thought I’d do a little house cleaning and follow up on the predicted atmospheric river for Seattle. Seattle did get its fourth AR in a row. Which is unbelievable, and will provide a road map for future powder days next year.
Below are the four charts representing atmospheric rivers roughly 64 days apart, from most recent to November ‘21. This is indisputable evidence that the weather cycles and repeats—as if you needed any more evidence.

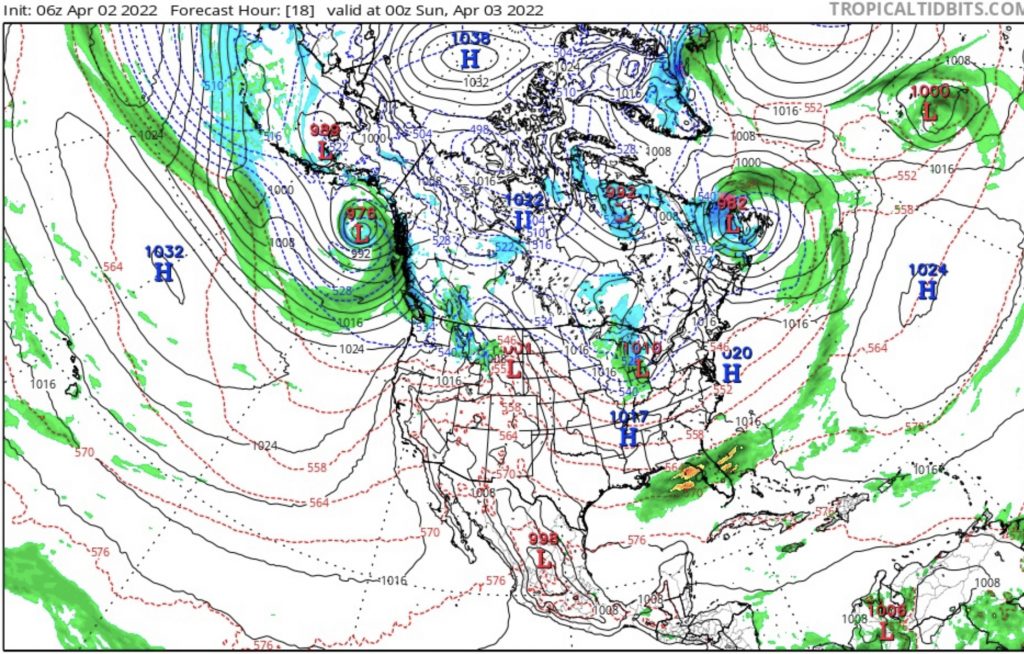
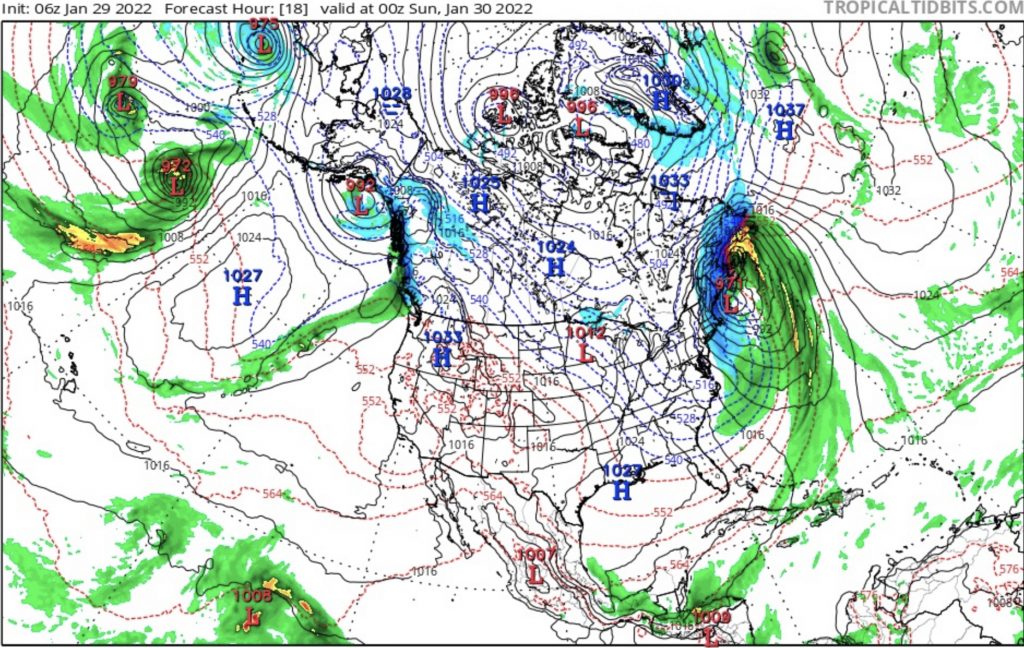
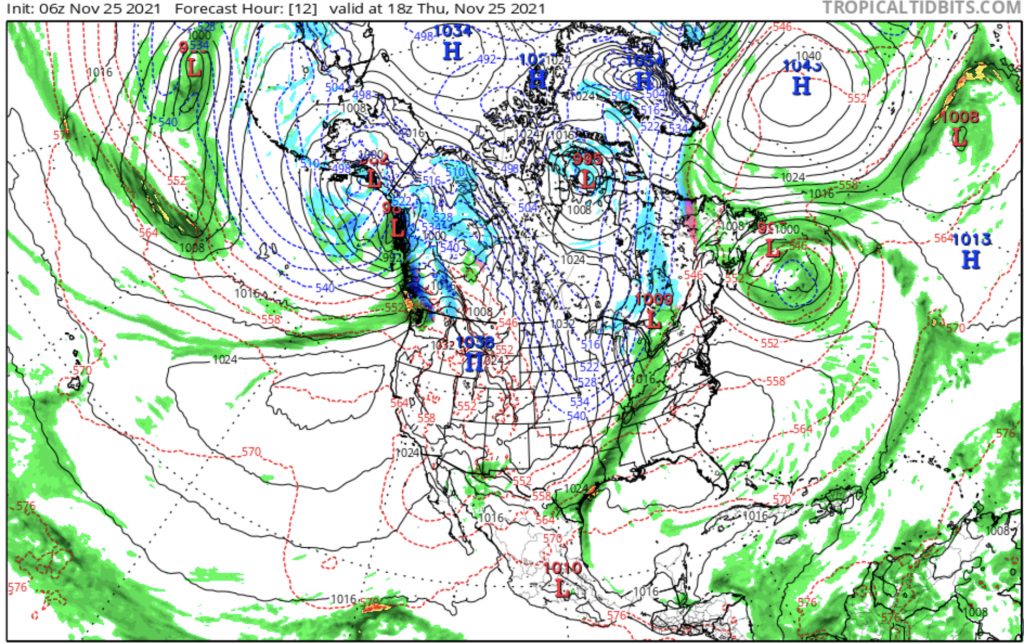
Looking at the charts you can see the low pressure in the Gulf of Alaska with an AR extending out in the Pacific in all charts. There are slight differences between them that are variations of the pattern.
‘Where Are We?
We are still in the northern pattern for a few more days, then we switch back to the active west pattern.
This next version of the active West Pattern, will be completely different from the winter pattern. Currently, we are in a summer pattern, so it will be similar to the pattern in late August September. The jet stream has receded north, so has the storm track, but the main trough producing systems will still drop down.
’22 Hurricane Predictions
 If you understand the CPH, you get a preview of what is to come for hurricane season, and when and where severe weather outbreaks will occur. This year, the Pattern shows a quiet hurricane season–not active. I am officially predicting a hurricane will hit one of these dates and locations:
Florida (Gulf side), around August 14
New England around September 5
Texas (coast) around September 28
I will put the odds around 70%, that a hurricane will form and hit one of those locations on those dates. If not, at least a strong tropical storm.
California Heat Wave
All of those blocking high pressure ridges off the coast of California, in cycle 3, will likely return in cycle 5 and there could be record heat in California and possibly wildfires June 14-26 and cycle 6 Aug 17-29.
California should get some relief at the end of that possible heatwave when a trough comes through. Below is the chart for what the June 26 (and Aug 29)trough should look like. I don’t expect this trough to drop this far south, but it should go as deep as Tahoe–hopefully.

The June/August charts will look like the chart above, when it shows up on the GFS—with seasonal differences. I expect the high pressure to be in a very similar position, as well as the low. It is this trough that will bring cooler air and possible rain, around June 26/Aug29.
From May 12 Update Follows
An extended dry stretch of 38 days, no precipitation in Tahoe from Jan 8 thru Feb 15, occurred in cycle 2. That corresponds to May 16 thru June 26. There are indications that that is setting up, however, there is a storm showing up on the GFS around May 26. It that storm goes “poof” then its game-on.
Update
The dry stretch is verifying, Tahoe has received two hundredths of an inch since May 16. Now we will see if that heat wave builds.
Last Thing Updated ENSO Chart Below
What is ENSO?
What is El Nino Southern Oscillation (ENSO)? ENSO is a climate driver that changes temperature and precipitation patterns throughout the world.
There are three phases–El Nino, Neutral, and La Nina. This diagram below shows the differences between El Nino and La Nina. Neutral falls in between the two.

Current ENSO Status
This was the second year in a row we had a La Nina winter, will it be 3-straight? Two winters in seventy-two years had triple-dip La Ninas, the odds are against it, for sure. However, NOAA writes in their April 25th ENSO (El Nino-Southern Oscillation) report, that there is a 59 percent likelihood of a La Nina Persisting into summer and a 50-55 percent chance remaining for the fall.
Below is NOAA’s long-range outlook predicting La Nina to continue thru the fall.

Updated Chart

We are trending in the right direction for our El Niño Prediction.
Washington Post Matthew Capucci on ENSO
Washington Post columnist Mathew Cappucci, BA Meteorology Harvard, says “Since bookkeeping began in 1950, there have been eight “double-dip” La Ninas, including the present. Only two ended up evolving to have a third consecutive La Nina winter.”
Cappucci further summarizes that La Nina, because it overlapped with record-breaking hurricane season in 2020 (30 named storms), followed by the third most named storms, in 2021, that La Nina patterns “bolster the risk of severe weather” during tornado and hurricane season. Which I would agree with. However, the cycling pattern, which sets up in the fall and cycles through the following fall, does have an indicator for the following hurricane season. Therefore, according to what happened last fall during the transition, it should be just the opposite–mild hurricane season.
Admittingly, it is not a strong correlation, due to only 20 years of data for the Cycling Pattern Hypothesis (Lezak et al, J Climatology Weather Forecasting 2018), but if my indicator is true, we will switch to El Nino this fall. With El Nino in place, there will be less hurricane activity. Which is what I am predicting.
Thank you for reading the blog, if you have any questions, as always, feel free to comment or send an email to Mike@FutureSnow.CO

Morning,
Do you forecast for Europe?
Best,
Octavio
When do you list your hurricane forecast for next year? Thanks in advance, Asim
The hurricane forecast will be out in March or early April. Thanks for being a member! Mike